Introduction to krunchbox Dashboards
This article will guide you through the process of accessing and interacting with dashboards in Krunchbox. Follow the steps below to learn how to navigate the dashboard interface, apply filters, save favorites, drill down into data, adjust timelines, export data, and share dashboards with colleagues.
Accessing the Dashboard Menu
At the top of your screen, tap Dashboards.
This action opens a drop-down list of dashboard categories.

Viewing All Dashboards
Select the All option to view every dashboard category available.
The dashboards are displayed in the menu on the left side of your screen.
Use the scroll bar to view the complete dashboard menu.
Dashboards are organized by category to help you quickly find the right one.
Selecting a Dashboard: From the menu, click on the Dashboard to want to use.

Filtering Dashboard Content
Internal Filters: Use the internal filters within the dashboard to include or exclude specific Retailers and product Categories.

To learn more about using the Internal Filters in Dashboards, watch the below short video:
Advanced Filters: Advanced filters allow you to filter based on Product Attributes or Store Attributes, as well as selecting the date in which you want to start your data.
Once you have made your selection in the Advanced Filters, click krunch.
Note: Selections made in the advanced filters affect all dashboards until these filters are cleared.

To clear advanced filters, tap on the Reset button.

Watch the following short video to learn more about the Advanced Filters in Dashboards:
Saving Customized Dashboards
Once you have applied your desired filters, you can save the dashboard view as a Favorite Dashboard. Your saved dashboards will update each week when new retail data is loaded into krunchbox.

Favorites can be accessed from the My Favorites drop-down menu or at the top of the dashboard menu.
Manage your saved favorites by clicking on the Settings icon where indicated.

Watch the following short video to learn more about saving Dashboards:
Working with Dashboard Tabs and Sorting
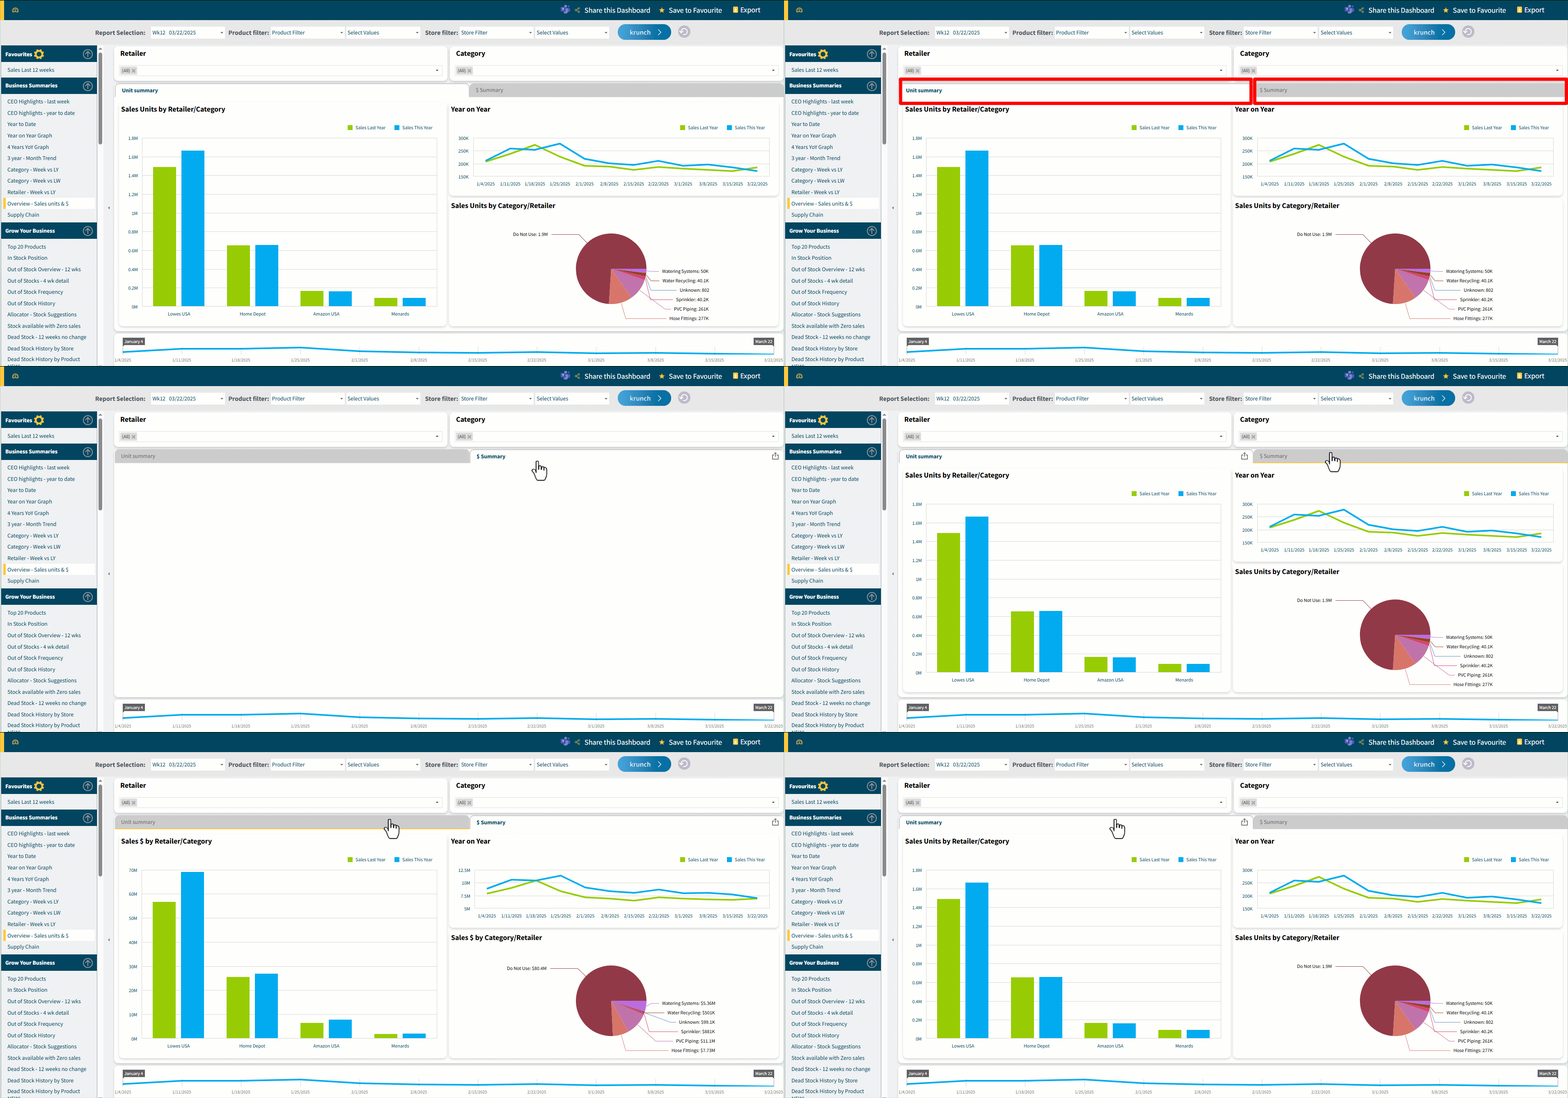
Utilizing Dashboard Tabs: Some dashboards feature multiple tabs to display data in different formats (e.g., sales units vs. dollar sales).

Sorting Data: Easily sort data by clicking on any of the column headings.
For example, clicking on the Last Week’s Dollar Sales header will rearrange the data from highest to lowest or lowest to highest.
You can sort any column in the Dashboards.

Exploring Advanced Features
Drilling Down into Data: Some dashboards allow you to drill down for more detailed information.
Example: click on a product to view its sales results at the store level.

Maximizing Dashboard Sections: To enlarge a specific section of the dashboard, click the Maximize icon.
Tap the icon again to return to the full dashboard view.

Adjustable Timeline: Certain dashboards include an adjustable timeline. For example, one dashboard displays sales data for the last 12 weeks.
At the bottom of your screen, you’ll see a timeline with the last 12 weeks represented.
Adjust the timeline by left clicking, holding, and dragging the ends to show a different number of weeks (e.g., the last four weeks).

Exporting and Sharing Dashboards
Exporting Options: Dashboards can be exported as an Excel file or as an image.

You may also export specific sections of a dashboard independently.

Watch the following short video to learn more about Exporting Dashboards:
Sharing Dashboards
To share a dashboard with colleagues, click on the Share This Dashboard option.
You can also share your dashboard via Microsoft Teams.

Watch the following short video to learn more about sharing your dashboard:
Need Help?
If you have any questions or need further assistance with dashboards, please contact our support team at support@krunchbox.com.